sabato 7 febbraio 2015
An Analysis of the MMT strenght

Together with Roberto Silvestri we wrote a paper on macroeconomic issues (SEP, School of European Political Economy). Here, what I want to report is maybe the most relevant section of this work. Macroeconomics continues to describe reality and lives through different economic schools views, as the last century mainly taught. There are many challenges beyond, so taking on also MMT can be a good exercise.
In order to verify the basic elements of MMT, we have decided to analyze three particular indicators of a selected countries sample: unemployment rate, inflation rate (CPI), government deficit. The period we have taken into account goes from 1999 to 2013. Data have been computed to obtain 3-year period mean. Hence, the outcome we have obtained, comprises five groups of means for each indicator for every country. We have selected the following countries: France, Germany, Greece, Japan, Italy, Spain, the United Kingdom, the United States of America. Our aims were to analyse a bigger data sample (starting from the 1970s) and combining data of each country in a 5-year mean in order to build a stronger model. Unfortunately, this was not possible because due to lack of data regarding some country dating back to before 1999. We begin with an analysis of the unemployment and inflation.
We begin with an analysis of the unemployment and inflation.
Unemployment - Inflation 1999-2001

2002-2004

2005-2007

2008-2010

2011-2013

On the basis of what MMTers say, the increase of public expenditure should stop when the full employment has attained. Hence, data should show high levels of inflation accompanied with low levels of unemployment or vice versa. Actually, we can note:
1. There is no correlation between the two indicators in the countries we have taken into account.
2. Some countries, such as Spain, have had historically a high level of unemployment independently from their level of inflation.
3. Germany cut down drastically its level of unemployment after 2007 as we can see from the change between the third and fourth scatter plot which is confirmed in the last one.
4. Even though there is no correlation, we can identify a cluster of countries, i.e. the United Kingdom, the United States and Japan, which always have low level of unemployment and a relative reduction of inflation rate over the years. In the last plot, we can see that Germany and France add to this cluster, although France reaches a level of unemployment which is almost twice that of Germany.
5. Another element to underline is a liftoff of unemployment in the last period, we have considered, in Greece and Spain. Italy shows a combination of high unemployment and low inflation (if it existed only Italy, the MMT rationale would be approximately confirmed). Unemployment-deficit from 1999 to 2001.
(Government) Deficit - Unemployment 1999-2001

2002-2004

2005-2007

2008-2010

2011-2013

MMTers theorized that unemployment is due to a too low level of public expenditure in order to balance the need to pay taxes and the desire to save money. So, we would find a high level of deficit accompanied with low level of unemployment or low level of deficit and high level of unemployment.
From the scatter plot we can note:
1. Even here it seems that there is no correlation at all between deficit and unemployment: many outliers compare in our sample over the years. For instance, in the last period, Spain and Greece show high unemployment and very low deficit (which is the opposite situation theorized by MMTers.
2. As for unemployment, the biggest dispersion happened in the run-up of the financial crisis of 2008.
3. USA seems to be the country which confirms best the MMT rationale (but USA is not the only country in the world!).
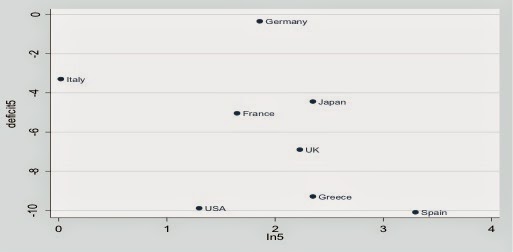
Inflation - (Gov) Deficit 1999-2001

2002-2004

2005-2007

2008-2010

2011-2013
SOURCE: OECD ECONOMIC OUTLOOK 2014
1. The first scatter plot (from 1999 to 2001) shows a situation of positive correlation between the two indicators because a low level of deficit (or a budget surplus) is accompanied with a high level of the other. In this case the outlier is Greece which ran high inflation and high deficit.
2. The periods going from 2008 to 2010 and from 2011 to 2013 (the last two scatter plots) display a certain level of negative correlation (exactly what we would find in our data) except for Germany which seems to play the role of the outlier.
3. France, Germany, Italy and Spain values are very close to each other from 1999. That’s due to the fact that they belong to the monetary union and have a unique monetary policy. Moreover, the primary objective of ECB (European Central Bank) which is “their Central Bank” is to keep price stability namely to maintain a level of inflation on average below but close to 2%. | permalink
Iscriviti a:
Post (Atom)